Observe the live playback and recording of audio files. Access the interface with a visualization window displaying the changes in volume and pitch. The app recognizes speech patterns and optionally isolates them for analysis and copying of elements.
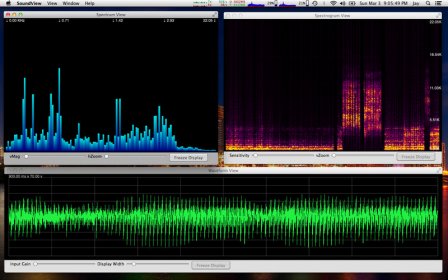
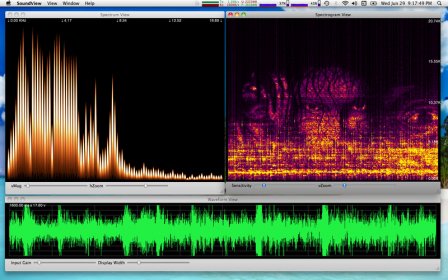
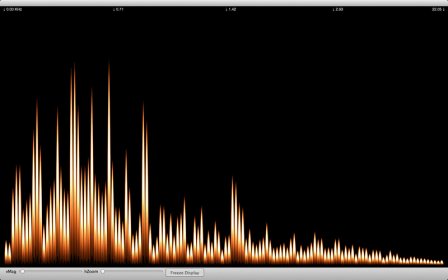
Sound View is an audio spectrum analyzer and spectrograph app. It analyzes sound from the built in microphone, or from the Line in input device, and displays the results in three separate views. The waveform view displays the raw input signal as a continuous wavy line, where each wave is a pulse of sound. The spectrum view displays the frequency distribution as vertical bars, each bar represents a group of frequencies, the height indicating the strength of those frequencies within the audio signal. The spectrogram view displays a two dimensional view of audio spectrum frequencies, over time. Each pixel represents a group of frequencies, it's color indicates the strength of those frequencies. The vertical rows represent different frequencies, and the horizontal columns represent time.
Frequencies range from 0 hertz to 22050 Hertz or 22K, this is half the sample rate of 44100 audio samples per second. That is the same sample rate as a compact disc audio recording.
Since it uses the microphone, it works well with iTunes. Any sound the mic can pick up is analyzed and displayed, so you can play music on your computer, or use a different sound system and see the frequency distribution, spectral density, and waveform.
Full screen display is available for each of these three views. Select the View menu item, then Full Screen Display, or you can use the Command-F keystroke. This will put the key or active window into fullscreen display mode. You can return to the windowed view by hitting the escape key.
In the waveform view, you can dynamically adjust the display width and height. The spectrum view allows similar adjustments, but you can also drag the display left and right, to see the frequencies that interest you.
The spectrogram view has controls for color intensity, and vertical zoom. It also allows you to drag the display up and down to see desired frequencies.
You can record a spectrogram for later viewing too. By selecting View -> Recording Control Panel you can start and stop recording and save your data.
Application Help is availble from the main menu under the Help item, and also from the help button on the preferences panel.
Comments