Hoecker-Plot is a graphical tool for quickly evaluating digital proofs based on the CIEDE2000 color difference formula. It consists of four boxes with different dimensions and colors (white, light gray, dark gray, and black). The boundaries of the boxes represent statistical data gathered from a set of color differences, and the size of each box is determined by the number of color differences between two boundaries. The different colors of the boxes are mainly for better distinction, and a completely green background is usually a good sign.
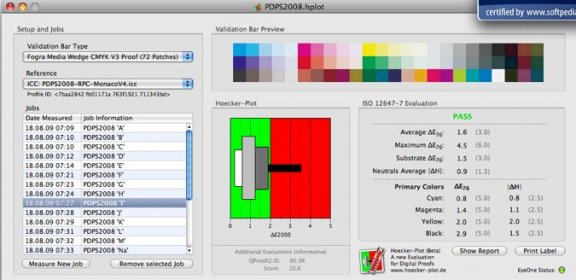
A Hoecker-Plot is a fast graphical evaluation for digital proofs based on CIEDE2000 color difference formula.
A Hoecker-Plot consists of 4 boxes of typically different dimensions and colors (white, lightgray, darkgray and black). The vertical boundaries of each box relate to some statistical information gathered from a set of color differences. The dimensions (areas) of the boxes depend on the number of color differences that fall in between two vertical boundaries. The different box colors are primarily for better distinction.
In general a completely green background is a good sign indicating that there should be no or only little need to worry about the proof quality. A green and red background alerts the user to pay attention and have a closer look at the plot characteristics (see the manual for more information).
Comments