Microsoft Excel helps you store, organize and process large quantities of data in spreadsheets. In addition, it facilitates data analysis and creates various types of graphs. Due to its large number of features, it is difficult to master them all. However, users can start using its basic functions from day one. Fortunately, there is a lot of documentation, including video tutorials, on how to use it. Moreover, there is a “what do you want to do?” dialog that provides you with quick assistance.
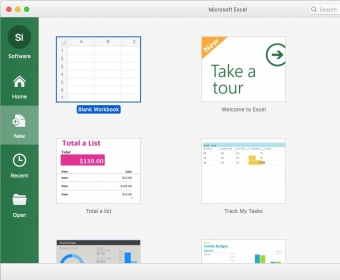
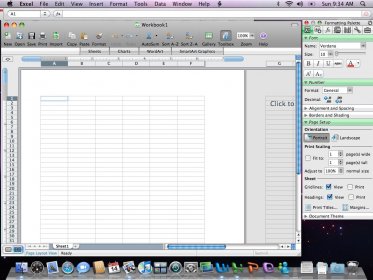
Microsoft Excel has a modern interface. In fact, some of its characteristics are so successful that they have been largely imitated in other products. This is the case of ribbons, a substitute for the common menu and toolbar, which helps you access the desired function more easily.
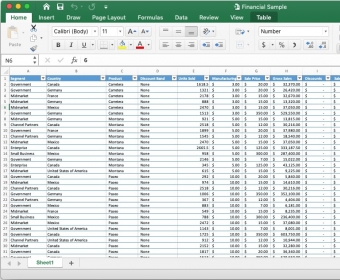
If you have used other spreadsheet editors before, it is unlikely that you have any difficulty to use Microsoft Excel’s basic functions. It has the same old grid structure with columns and rows. Likewise, each cell can hold various types of data, such as text, date, numeric and currency.
However, its real power is unleashed when you use formulas to perform some kinds of calculations. In this respect, there is a wide range of formulas you can use, organized into categories, like financial, date and time, mathematical, trigonometrical, statistical, logical and database. Fortunately, formulas are automatically completed as you type them. Regrettably, errors in the formulas are possible and the help you get does not always solve the issue. more


KnowledgeMiner (yX) for Excel (was (yX) for Excel) offers two data modeling applications -- (yX) for Excel and KnowledgeMiner 6.0...

It helps you fix corrupt Excel (.XLS/.XLSX) files and restore everything.

Quickest, most efficient, safest and cheepest way to bring your Excel data and Excel charts to life with your mouse!


Comments (1)