v10.0
- An option has been added in Graph Builder and Control Chart Builder to enable a graph to collect and display missing values for categorical variables. To access this feature, select Include Missing Categories from the red triangle menu in Graph Builder or in Control Chart Builder.
- Columns in a Variable Importance Plot can be selected and the analysis repeated with just the significant columns in the Partial Least Squares Platform. To access this feature, select VIP vs Coefficients Plots from the red triangle menu in Fit Results.
- Missing data imputation is available in the Partial Least Squares Platform in JMP Pro via a check box on the launch window entitled Impute Missing Data.
- Platforms (Fit Y by X, Fit Model, Time Series, and Control Chart) have been added to the Excel Profiler. Click the appropriate button in the JMP Add-in for Excel ribbon bar to invoke the selected platform.
- The JSL function New Table() accepts the optional argument "private", which creates a new table as a private data table. Private data tables are not displayed and do not show in the Home Window/Window List.
- Interval-censored test plans can be produced in the Accelerated Life Test Design platform within the Design of Experiments tools.
- JSL File and Directory commands are available, including File Exists( path ), Directory Exists( path ), Copy Directory( from, to, {1/*recursive*/} ), Copy File( from, to ), Move Directory( from, to ), Move File( from, to ), Rename Directory( old, new ), Rename File( old, new ), Delete Directory( path ), Delete File( path ), Create Directory( path ) Last Modification Date( path ), and Creation Date( path ).General Improvements
- Right-clicking anywhere to the right of the last column in a data table to add multiple columns defaults to After Last Column.
- Creating a summary table by grouping retains any excluded rows.
- Rows and cells can be dragged and dropped between two JMP sessions.
- A run of missing values at the beginning of a column no longer sets the format.
- Saving a data table as a PDF is no longer limited to 1000 pages on Windows.
- The Selection tool and copying contents function properly in a Journal.Statistics and Graphics
- Predicted values and residuals take a blocking variable into account in the Fit Y by X Platform.
- The REML Method renders confidence intervals for the total variance component when the total is confounded with the residual in the Fit Model Platform.
- The REML Method yields results when a categorical fixed effect has only one level in the Fit Model Platform.
- The Save Inverse Prediction Formula processes group data in the Fit Curve Platform.
- Rows with missing values in the grouping column are ignored in the Fit Curve Platform.
- The Bartlett Test for eigenvalues runs faster in the Principal Components Platform.
- Interactive Forecasting plots reflect forecast values determined in the Time Series Platform.
- Out of Control points are detected when applying the Test Beyond Limits warning in a NPchart.
- An error message appears if frequencies exceed set limits when producing a Stem and Leaf plot for a Distribution report.
- Normal Quantile Plots are expanded when there is a frequency variable in a data set in the Distribution Platform.
- Power calculations compute results for interactions involving three or more level categorical factors.
- The Bias Comparison option creates an Analysis of Means chart in the Measurement Systems Analysis Platform that incorporates the set alpha level.
- Methods have been added for Visual Basic automation in the Measurement Systems Analysis Platform.
- Missing values in a response variable are implemented within the Boosted Tree method in the Partition Platform.
- An error message appears in the Gaussian Process Platform when you process a data table with more than 2500 rows; with a recommendation to try the Neural Platform instead.
- The n>=3 constraint in the Reliability Demonstration has been removed in the DOE Sample Size and Power Platform.
- The Make Combined Data Table option within Capability Analysis results no longer yields empty response columns.
- Missing data can be imputed when a covariance matrix is singular in the Multivariate Platform.
- A data table associated with an application source file can be closed before closing the .jmpappsource file in the Application Builder.
- Pict Box allows images to be dragged and dropped, and manipulated appropriately in the Application Builder.Control Chart Builder
- Modeling types for all phases and X variables, if there is either a phase or another X variable present, are treated as categorical.
- Westgard Rules, Western Electric Rules and Test Beyond Limits are scriptable. Westgard Rules and Test Beyond Limits take into account charts with unequal sample sizes. Test Beyond Limits has been added as a warnings option for dispersion charts.
- Data in which a single subgroup has a sample size of more than one default to an XBar/R chart.
- Switching from IMR to XbarR and vice versa works effectively via the column switcher.
- Control Chart Builder does not extend the size of one zone over another. If the limits are not centered around the mean, (UCL-Avg)/3 is used as the width of each zone. Zones are not drawn below the lower limit (LCL) or above the upper limit (UCL).
- The platform does not currently accept categorical Y columns so response variables are removed from a chart if they are changed to be Nominal or Ordinal.Graphics
- Nominal axis properties function properly when charts are copied and pasted into other applications.
- The option to plot residual values versus actual x-values was returned to the application.
- Changes to Legend Settings in charts in the Chart Platform and Overlay Platform are applied.Scripting
- The Include() function allows unrecognized file extensions to be processed as JSL.
- The For Each Row() function repeats the script on each row for multiple columns.
- The OutlineBox Set Menu Script message can be used to create a journal from a report.
- Closing a hidden table no longer makes the analysis close.
- Nested comments are displayed in the script editor.
- Parts of encrypted scripts can be exposed while other parts are kept hidden.
- Col Quantile allows an expression as its first argument.
- Identical table scripts are not duplicated during concatenation.
- Column Properties can be assigned in a data table via the script Add Column Properties().
- Axis specifications are retained in a saved table script (Script > Save to Data Table).
- Reports can be saved via Script > Script All By-Groups. The option appears if you have specified a By variable in the platform launch window.Graph Builder
- Modified markers in a legend are recognized within a script.
- Stacked bar charts display negative values when a bar contains absent categories.
- The Okinawa prefecture is included in the map of Japan.
- A graph updates when a variable's Value Ordering property is changed.
- The Area Style is applied correctly when there are missing values.
- Box plots may be used on a graph having continuous X and Y variables.

Google Earth Pro gives advanced business tools in addition to all the easy-to-use features and imagery of Google Earth.

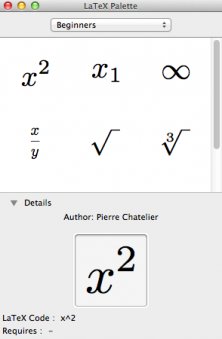
Small utility that allows you to quickly typeset LaTeX equations, without bothering with file creation, preambles, and so on.