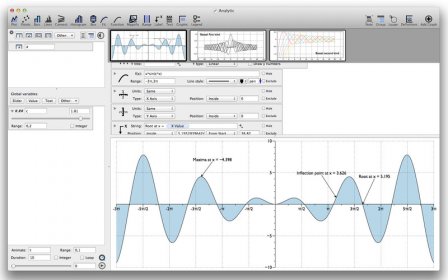
Create charts and graphs for a variety of projects by importing relevant data into the program and selecting one of the available templates to organize the information. Analytic functions, axes, bar graphs, composite, dates, drawing, function fits and other types of graphs are available.
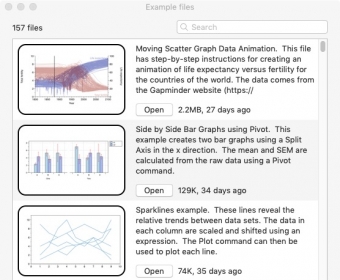
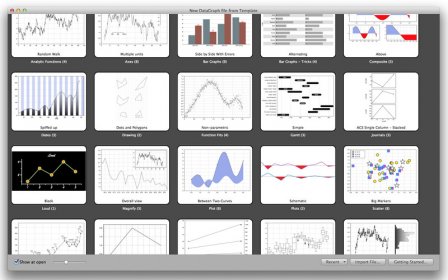
DataGraph can generate graphs and charts from the data supplied. Fortunately, you do not need to start from scratch as there is an extensive library of templates to choose from. Likewise, there are more than 157 sample files to help you explore the app’s potential. However, I should alert you this is not one of those tools you can use fluently from the beginning, which is why consulting the accompanying manual is a great idea.
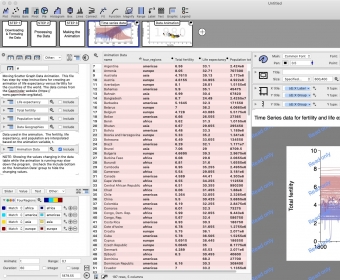
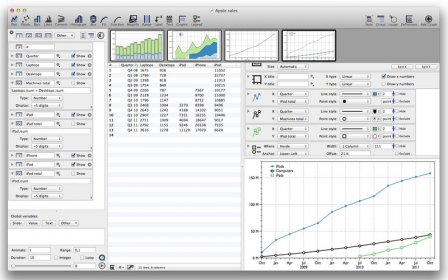
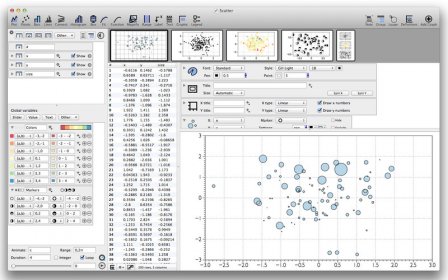
The application has a compact interface, which allows you to visualize the source data, interact with them and preview the graph in a single window. There is also a sort of ribbon to which you can add the different steps in the workflow, including downloading and formatting the data, processing the data, and generating the graphs. In this respect, it is possible to define the desired functions from the panel on the left.
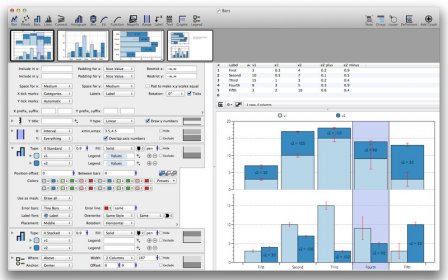
As said, the best part of this app is its great library of premade graphs and charts, which will save you a lot of time. Luckily, it is easy to browse them as they are arranged by type. Besides, you have the possibility to preview their thumbnails and have an idea of the results. The library includes such models as Gantt charts, pivot tables, plots, scatters, bar graphs and many others. Once you have selected a graph type, it is possible to further customize it by changing its properties, such as fonts and colors.
Good news is that the resulting project can be saved for future use. Likewise, the possibility of exporting graphs in a wide array of picture formats allows you to insert them in your documents and presentations without any difficulties. Likewise, it is allowed to copy the graph to the clipboard and paste it somewhere else. Similarly, it supports sharing the underlying code.
All in all, DataGraph creates high-quality output from a set of data, including animations. However, it supports only two-dimensional graphing. It is good that the app can be invoked from the command line and Automator. Luckily, there is a trial version available from the developer’s site, for you to see if it is what you really need.

Comments