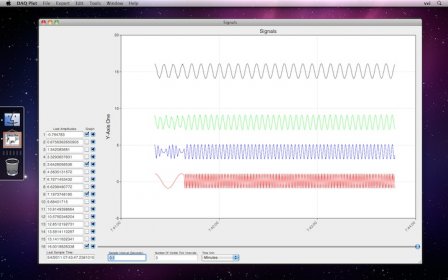
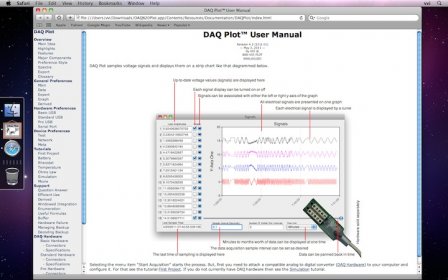
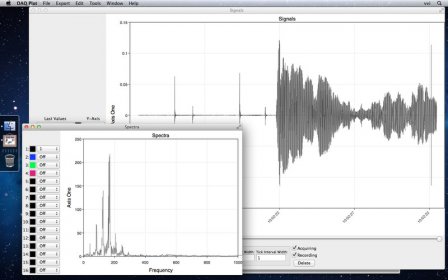
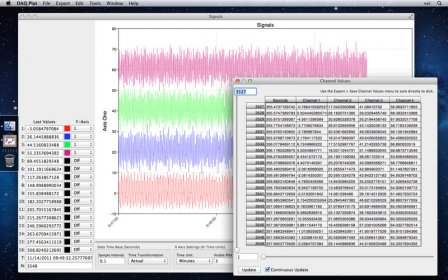
DAQ Plot is a simple to use strip chart application that plots electrical signals and controls devices in realtime using digital output channels and built-in feedback control loops. Use the screw connectors on the accompanying data acquisition hardware to attach sensor wires and watch the signals graph in realtime. It's that easy. Voltage is displayed in a real-time strip chart fashion.
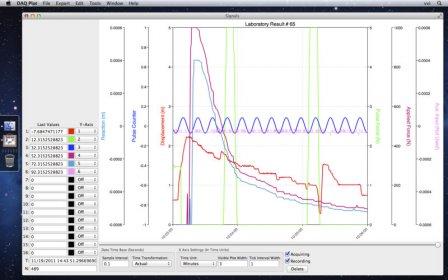
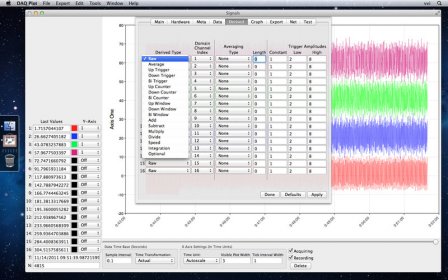
With DAQ Plot you can control other hardware such as valves and switches using the digital output connectors and their associated user interface switches. It also has built-in feedback loops so you can control processes based on input values. The effect of the feedback and control switch settings are immediately viewed on the real-time strip chart so you can monitor and assure your process as it happens.
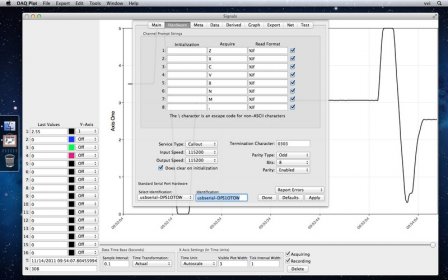
You can hook up nearly any sensor that has an output voltage within the range interval of the DAQ Hardware, typically from around 100 millivolts to 10 volts. Amplifiers and signal conditioners permit plotting from strain gages, thermocouples or any other sensor. This manual includes basic experiments, information on ordering different sensors and describes fundamental electrical concepts. Because of its ease of use and versatility DAQ Plot is perfect for the inquisitive mind, from secondary school science experiments to research laboratory settings.
Seconds to months worth of data can be displayed at one time. Parameters can be change dynamically, including sample resolution, scroll back, autoscaling and gain settings. Data sampling is continuous and can be turned on and off as needed. Voltage time series can be saved, retrieved and appended, exported to spreadsheet applications or other applications and exported to a full-featured graph layout application for publication quality results.


Comments