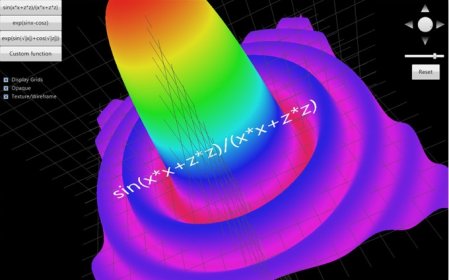
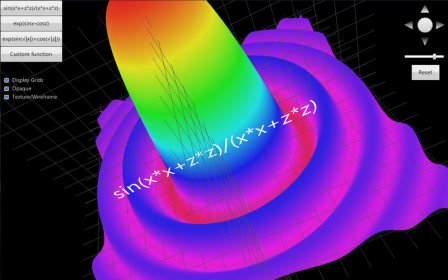
MathViz allows you to visualize any function of two variables y=f(x, z) in brilliant colors.
There are a couple of pre-built functions, and you can add your custom function and visualize it.
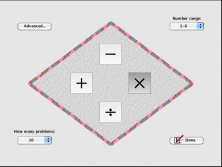
You can rotate around all 3 axis (X, Y and Z) as well as zoom in and out using the controls.
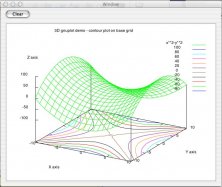
Portable command-line driven interactive datafile (text or binary) and function plotting utility for UNIX...


Comments